top of page

I will use the MSE, RMSE values and coefficient of determination value to evaluate the performance of my model. Mean square error (MSE) is the average of the square of the errors. The larger the number the larger the error. The coefficient of determination is a measurement used to explain how much variability of one factor can be caused by its relationship to another related factor. This correlation, known as the "goodness of fit," is represented as a value between 0.0 and 1.0. Concretely, a value of 1.0 indicates a perfect fit, and is thus a highly reliable model for future forecasts, while a value of 0.0 would indicate that the calculation fails to accurately model the data at all.
ex1 evaluate: Text
ex1 evaluate: Image
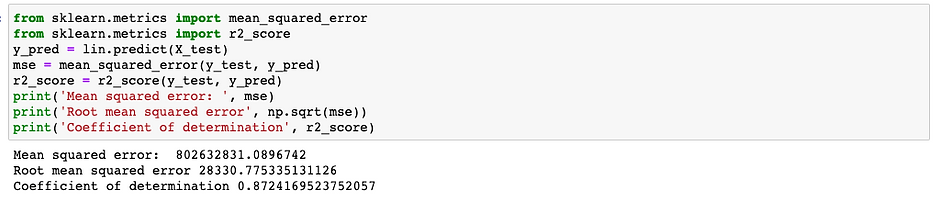
The first thing I noticed after evaluating my model for the experiment 1 is that my coefficient of determination is 0.87, which is pretty high. This correlation value means about 87% of the data fit the linear regression model in the experiment 1. However, we can see that my MSE value and RMSE value for experiment 1 are very high, which means my model did not perform well. There are 2 main reason I could think of that made my model perform poorly on this dataset. The first reason is that i used all the features to predict, I did not filter the features that correlated to the target (SalePrice) so there was a high chance that I used the irrelevant features with low correlation to the target to predict the target. The other notable reason I could think of is that the target (SalePrice) is positively skewed, not correctly skewed as I stated in the data understanding step. I will have to do some further observation, researches to come up with effective reasons to solve these two problems in order to improve the performance of my model on this dataset.
Download my Jupyter Notebook to view my code.
ex1 evaluate: Text
bottom of page