top of page

I used this function to see how many rows and columns this data set contains
data understanding: Text

data understanding: Image
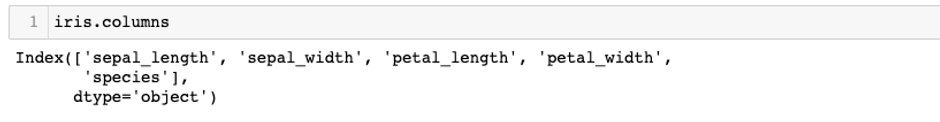
I used this function to see the names of columns in this dataset. Through the names of columns, I am able to have the insight or the initial understandings about this dataset.
data understanding: Text
data understanding: Image
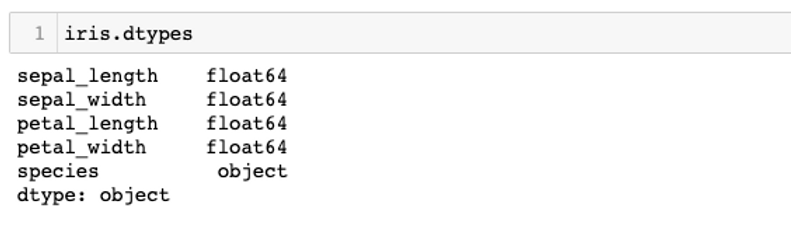
I will use this function to observe the types of data in this dataset
data understanding: Text
data understanding: Image
After observing the type of data in this Iris dataset, I noticed that all the features that I will use to build and train my clustering model are numerical, which is suitable with my intended use so I will not transform the type of any data in this dataset and keep them as they are. Notably, I also noticed that the object of 'species' column is categorical data however this column will be our target and since we will be building and training a clustering model so I will not pay attention to this column or the type of data in this column.
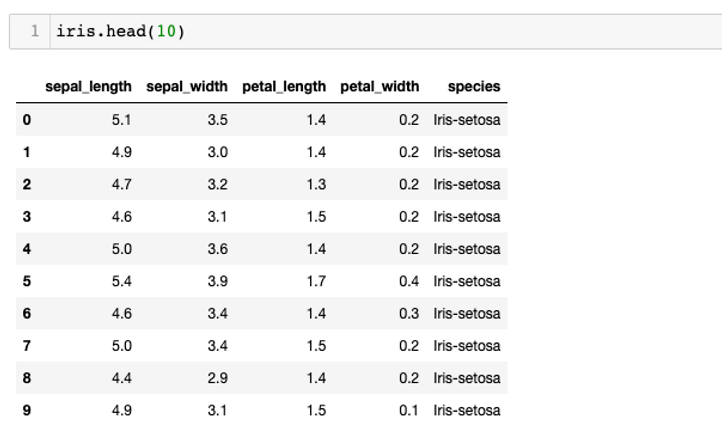
I used this function to see the first 10 rows of the dataset to make a quick observation about the values.
data understanding: Text
data understanding: Image
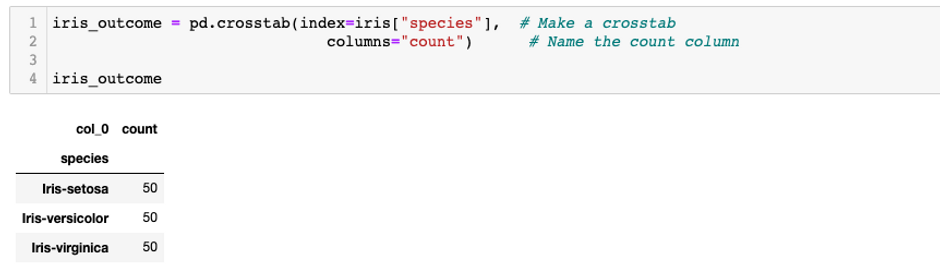
Next, I will observe the frequency distribution of species
data understanding: Text
data understanding: Image
Looks like our target is divided evenly to 3 different types of spiece, which are Iris setosa, Iris versicolor and Iris virginica.
Let see how different features distributed to each different types of specie.
data understanding: Text

data understanding: Image
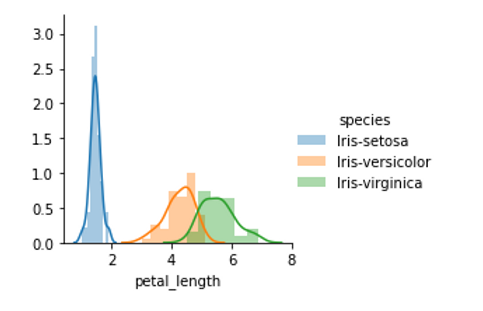
data understanding: Image
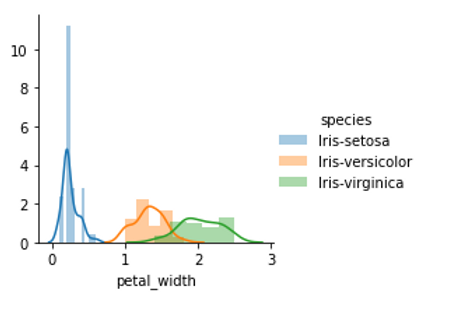
data understanding: Image
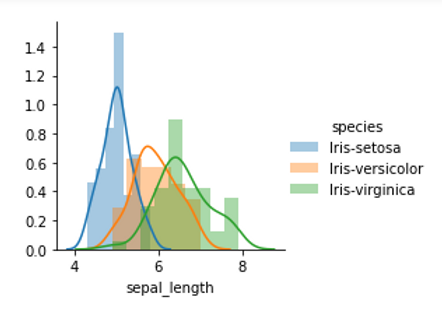
data understanding: Image
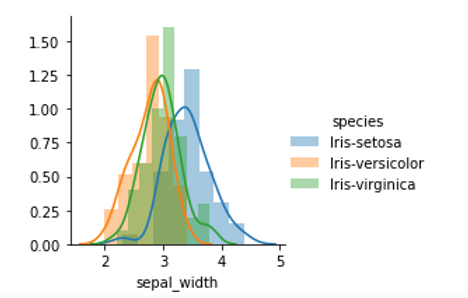
data understanding: Image
Now, I will create 2 visualizations, one with 'Sepal width' and 'Sepal length', one with 'Petal width' and 'Petal length'. By observing these 2 visualizations, I will have an insight about how these two pairs of features help distinguish between setosa, versicolor and virginica.
data understanding: Text

data understanding: Image
After observing the two above visualizations, I noticed that using the pair of 'Petal width' and 'Petal length' feature helps distinguish the 3 different types of species clearly. Looking at the visualization of the pair of 'Petal width' and 'Petal length' feature, we can clearly see that all the red points are gathered together, orange points are gathered together and grey points are gathered together. This makes the visualization of 'Petal width' and 'Petal length' is divided into 3 clearly separated areas, in other words, it creates 3 separated clusters. On the other hand, in the visualization of the pair of 'Sepal length' and 'Sepal width' features, we can see that there are lots of overlapping points between orange points and grey points, therefore we do not see the clearly seperated areas, in other words, seperated clusters.
data understanding: Text
data understanding: Text
bottom of page