top of page

I will use K-means clustering approach to do clustering on this Iris dataset. K-means is a centroid-based algorithm, or a distance-based algorithm, where we calculate the distances to assign a point to a cluster. In K-Means, each cluster is associated with a centroid. The main reason made me choose K-means algorithm for this Iris dataset because it is easy to interpret and work around with. More importantly, K-means clustering algorithm is a perfect choice for this Iris dataset in term of the type of data in this dataset and the small number of features (only 4 features).
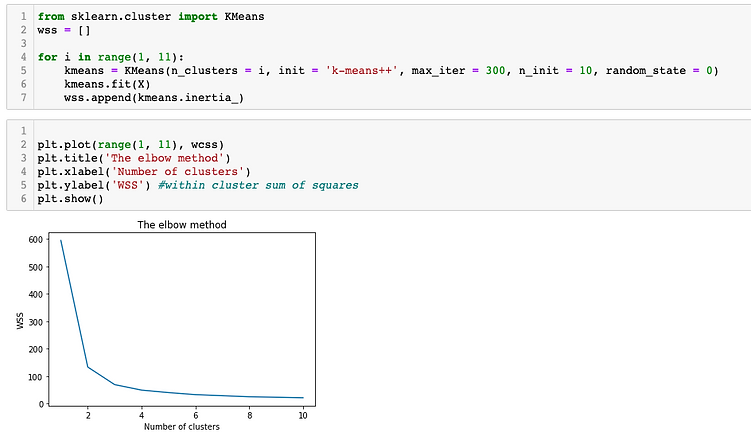
I will determine the optimal number of cluster using the elbow method.
Since the basic idea of the clustering approach including K-means algorithm is to define clusters such that the total within-cluster sum of square (WSS) is minimized. The total WSS measures the compactness of the clustering and we want it to be as small as possible.
The Elbow method looks at the total sum of square as a function of the number of clusters so we should choose a number of clusters so that adding another cluster doesn’t improve much better the total sum of square.
modeling: Text
modeling: Image
Looks like the most optimal number of cluster in this Iris dataset is 3 since we can see in the above figure that the sum of squares value drops dramatically with the number of cluster increasing from 0 to 3. After the value 3, the change in the sum of squares value is relatively small. In short, we can conclude that 3 is the most optimal number of clusters so that adding another cluster doesn’t improve much better the total sum of square.
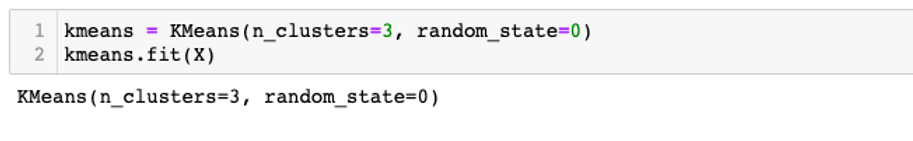
Now, I will build and train my K-means model with 3 clusters.
modeling: Text
modeling: Image
Now, I will print out the labels for our data point
modeling: Text

modeling: Image
The output is a one dimensional array of 150 elements corresponding to the clusters assigned to our 150 data points. We can see that the first 50 points have been clustered together (all of them have the label of 1). The next 50 points have also been clustered together (the majority of them have the label of 0). And the last 50 points have also been clustered together (the majority of them have the label of 2). Here 0, 1 and 2 are merely used to represent cluster IDs and have no mathematical significance.
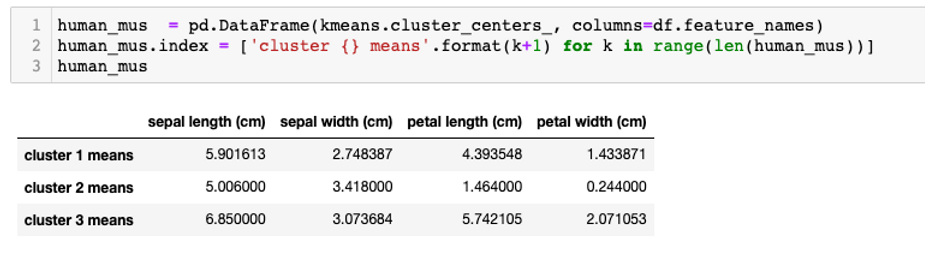
Now, I will print out the centroid values for our 3 clusters.
modeling: Text

modeling: Image
The three centers can be presented neatly with DataFrame as below
modeling: Text
modeling: Image
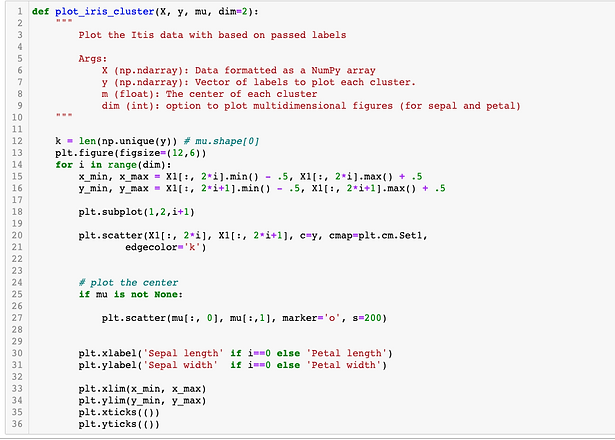
Now, I will visualize our 3 clusters with the three centroids that we just defined.
modeling: Text
modeling: Image
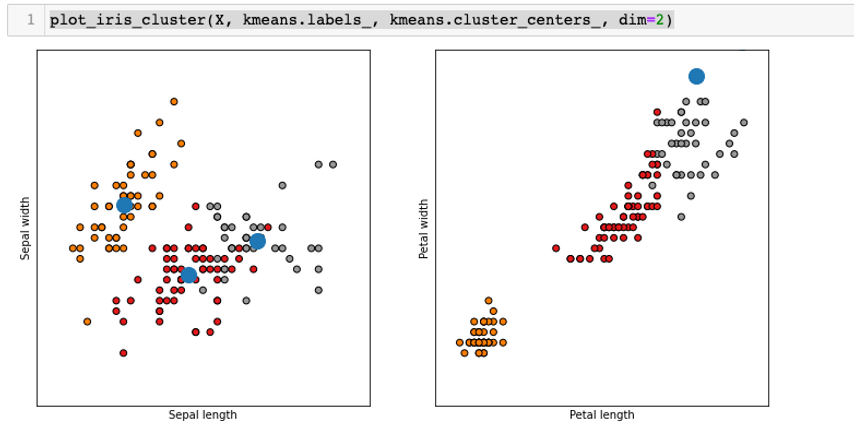
modeling: Image
Based on the graphs above, we can tell that the k-means clustering algorithm performed well on clustering the data based on sepal width and sepal length even though there are still the notable amount of overlapping points. On the other hand, k-means clustering algorithm did not perform well at all on clustering the data based on petal length and petal width.
Now, I will compute the actual accuracy and further visualize our mislabeled data.
modeling: Text
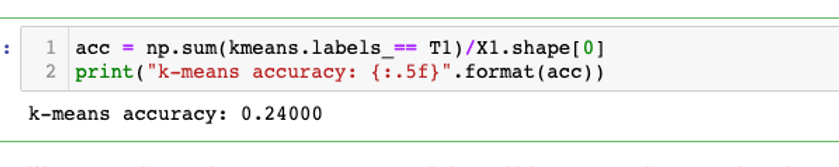
modeling: Image
We can see that our k-means accuracy score is low, which means our k-means clustering model is not performing well. I will create a visualization between our actual target (T) and the clusters that are defined by our k-means clustering model to see what is happening and what is causing the poor performance of our our k-means clustering model.
modeling: Text
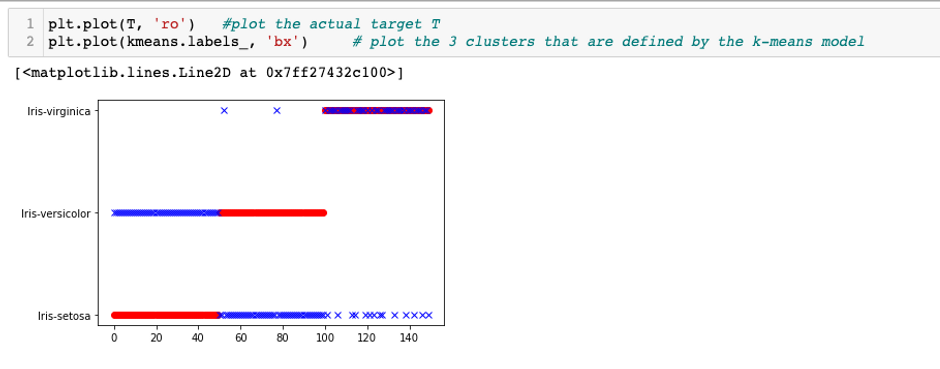
modeling: Image
From the figure above, I observed that the k-means clustering algorithm with all 4 features only successfully and correctly clustered the Iris-virginica while our target in the original dataset has 3 spieces and in the graph above the Iris-versicolor and Iris-setosa are not clustered correctly so thats why the accuracy score of our k-means clustering model is not good.
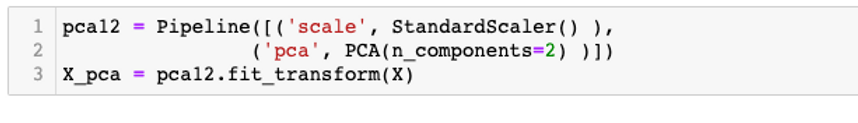
Now, I will use the PCA to transform our dataset by reducing dimensionality from 4 dimensions (features) to two dimensions (2 features) so that we will only have two features to consider while clustering.
However, I will still create a pipelined PCA with 4 components at first.
modeling: Text

modeling: Image
Here we can clearly see that the first two components are mainly affecting the variation of the principal components while the last two components are not affecting much. It is pretty safe to say that the first two components, in other words, the first two features (Sepal length and Sepal width) would be the best to consider to while clustering. Now, we can reduce dimensionality form 4 dimensions (features) to two dimensions (2 features).
modeling: Text
modeling: Image
Now, I will train my K-means clustering model again but now I will use X_pca
modeling: Text
modeling: Image
Now, I will compute a new accuracy score for my K-means clustering model that was trained with X_pca
modeling: Text

modeling: Image
We can see that the k-means accuracy score is now relatively high, which is around 0.83. This means that our clustering model now performs much better after reducing dimensionality from 4 dimensions (features) to two dimensions or 2 features which are Sepal length and Sepal width. In other words, we can tell that the k-means clustering algorithm performed well on clustering the data based on Sepal width and Sepal length. Notably, this conclusion totally matches with the observation that I claimed above about the better performance of k-means model based on Sepal length and Sepal width features.
Now, let's me visualize how reducing dimensionality from 4 features to 2 features (Sepal width and Sepal length) would help improve the performance of my k-means clustering model.
modeling: Text
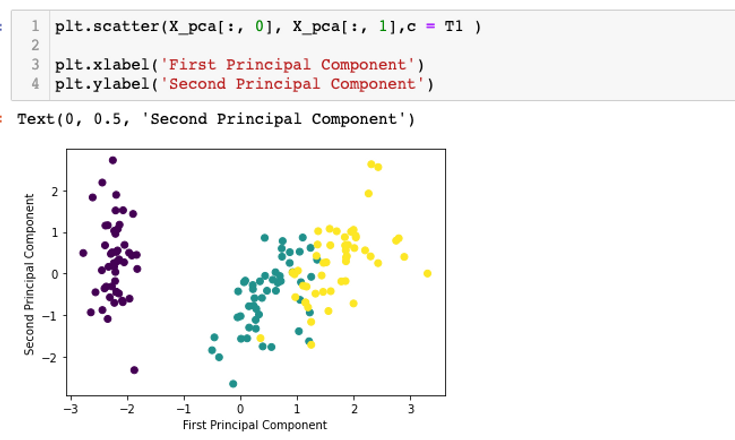
modeling: Image
modeling: Text
bottom of page