
Project 4: Clustering on Iris dataset
In this project, I will experience with clustering approach in the Iris dataset from sklearn.
Introduce the problem
In this project, I will experience with clustering approach on the Iris Dataset from scikit-learn. I will use K-means clustering method, which is one of the most notable clustering approach to build and train a clustering model on the Iris Dataset using the features including Sepal length, Sepal width, Petal length, Petal width. After building and training the K-means clustering model, I will observe how the K-means clustering model perform on clustering the three different species of Iris including Iris-setosa, Iris-virginica and Iris-versicolor. In other words, I will conduct a study on which features will help us distinguish those three kinds of species of Iris. Moreover, after evaluating the performance of my K-means clustering model using all four features, I will dive into explaining the reason behind the performance of my K-means model. Notably, I will also use PCA, which is a notable feature extraction method, to improve the performance of my K-means clustering model. Overall, throughout this project, I would like to answer these two main questions:
1. How K-means model would perform the clustering on this Iris dataset using all four features?
2. Would reducing dimensionality using PCA improve the performance of the K-means clustering model on this Iris dataset?
Brief overview about clustering
Clustering is a type of unsupervised learning method of machine learning. In the unsupervised learning method, the inferences are drawn from the data sets which do not contain labelled output variable. It is an exploratory data analysis technique that allows us to analyze the multivariate data sets.
Clustering is a task of dividing the data sets into a certain number of clusters in such a manner that the data points belonging to a cluster have similar characteristics. Clusters are nothing but the grouping of data points such that the distance between the data points within the clusters is minimal.
In other words, the clusters are regions where the density of similar data points is high. It is generally used for the analysis of the data set, to find insightful data among huge data sets and draw inferences from it. Generally, the clusters are seen in a spherical shape, but it is not necessary as the clusters can be of any shape.
Since I will be using K-means clustering method to build and train the clustering model throughout this project so I would like to briefly talk about what K-means clustering is and how it works. K-Means clustering is one of the most widely used algorithms. It partitions the data points into k clusters based upon the distance metric used for the clustering. The value of ‘k’ is to be defined by the user. The distance is calculated between the data points and the centroids of the clusters.
The data point which is closest to the centroid of the cluster gets assigned to that cluster. After an iteration, it computes the centroids of those clusters again and the process continues until a pre-defined number of iterations are completed or when the centroids of the clusters do not change after an iteration.
I also would like to point out one of the most notable drawbacks of K-means clustering algorithm that K-means is a very computationally expensive algorithm as it computes the distance of every data point with the centroids of all the clusters at each iteration. This makes it difficult for implementing the same for huge data sets.
Introduce the data
This Iris dataset is from scikit-learn. The data set consists of 50 samples from each of three species of Iris (Iris setosa, Iris virginica and Iris versicolor). Four features were measured from each sample: the length and the width of the sepals and petals, in centimeters:
sepal length in cm
sepal width in cm
petal length in cm
petal width in cm
class: -- Iris Setosa -- Iris Versicolour -- Iris Virginica
Data Understanding
For the data understanding step for this project, I will just quickly observe the shape, the column name, the type of the data in the Iris dataset to have the insights about this dataset. Notably, after observing the type of data in this Iris dataset, I noticed that all the features that I will use to build and train my clustering model are numerical, which is suitable with my intended use so I will not transform the type of any data in this dataset and keep them as they are. Notably, I also noticed that the object of 'species' column is categorical data however this column will be our target and since we will be building and training a clustering model so I will not pay attention to this column or the type of data in this column. Moreover, I will also create some visualizations using seaborn package to visualize how different features distributed to each different types of specie, which helps me have some insights before building the K-means clustering model.
Click the button below to read more about my data understanding step.
Preprocessing
For the preprocessing step of this project, I will not do much since this Iris dataset from scikit-learn is a clean, neat and ready to use dataset. I will only check if this dataset contains any missing values. Moreover, I will check the type of data in this dataset to see if I need to transform the type of any data to serve the purpose of my project. Remarkably, in this preprocessing step, I will split the Iris dataset into X containing the features, which are petal_length, petal_width, sepal_length, sepal_width and T containing the target, which is the different types of specie (setosa, versicolor, virginica) in order to build and train the K-means clustering model.
Click the button below to read more about my preprocessing step
Modeling (Clustering model)
I will use K-means clustering approach to do clustering on this Iris dataset. K-means is a centroid-based algorithm, or a distance-based algorithm, where we calculate the distances to assign a point to a cluster. In K-Means, each cluster is associated with a centroid. The main reason made me choose K-means algorithm for this Iris dataset because it is easy to interpret and work around with. More importantly, K-means clustering algorithm is a perfect choice for this Iris dataset in term of the type of data in this dataset and the small number of features (only 4 features).
I will determine the optimal number of cluster using the elbow method. After building and training the K-means clustering model using all four features, I will evaluate the performance of my K-means model and will also explain the reason behind my K-means model's poor performance. Notably, I will reduce dimensionality of this Iris dataset by using PCA, which is one of the most notable extracting feature methods, to improve the performance of my K-means clustering model on this Iris dataset.
Click the button below to read more about my clustering step.
Storytelling
Throughout this project, I gained some valuable hand-on experiences on working with clustering models through building and training K-means clustering model on the Iris Dataset.
I used elbow method to get the optimal number of cluster in this dataset, which is 3 since the sum of squares value drops dramatically with the number of cluster increasing from 0 to 3. After the value 3, the change in the sum of squares value is relatively small. In short, we can conclude that 3 is the most optimal number of clusters so that adding another cluster doesn’t improve much better the total sum of square.
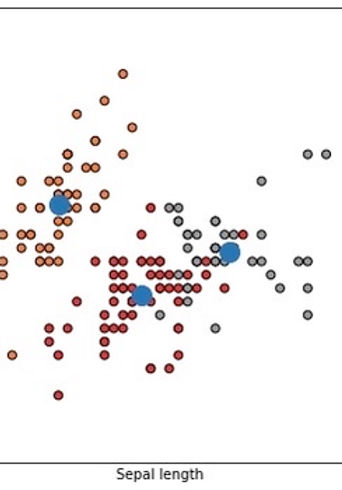
After defining the optimal number of cluster, I built and trained my K-means model with 3 clusters and using all 4 features in the dataset. Based on the visualizations of the three clusters with the three centroids I just defined, I observed that the K-means clustering algorithm performed well on clustering the data based on sepal width and sepal length even though there are still the notable amount of overlapping points. On the other hand, K-means clustering algorithm did not perform well at all on clustering the data based on petal length and petal width. This was not a good sign so I computed the accuracy score of my K-means model to see how well my clustering model performed on this Iris dataset using all four features. The accuracy score was just 0.24, which was very low. This definitely means my K-means model was not performing well on this Iris dataset using all four features.
To dive deeper into the reason behind the poor performance of my K-means model, I created a visualization between our actual target (T) and the clusters that are defined by our K-means clustering model to see what is happening. Based on this visualization, I observed that the k-means clustering algorithm with all 4 features only successfully and correctly clustered the Iris-virginica while our target in the original dataset has 3 spieces and in the graph above the Iris-versicolor and Iris-setosa were not clustered correctly so thats why the accuracy score of our k-means clustering model was not good.
In order to improve the performance of my K-means model, I used PCA, which is a very popular feature extraction method, to transform our dataset by reducing dimensionality from 4 dimensions (features) to two dimensions (2 features) so that we will only have two features to consider while clustering. However, at first, I still created a pipelined PCA with 4 components and after computing the explained_variance_ratio_ value and singular_values_ value, I observed that the first two components are mainly affecting the variation of the principal components while the last two components are not affecting much. It is pretty safe to say that the first two components, in other words, the first two features (Sepal length and Sepal width) would be the best to consider while clustering. Now, we can reduce dimensionality form 4 dimensions (features) to two dimensions (2 features). Notably, after training my K-means model again with the transformed X after reducing dimensionality, the new accuracy score of my K-means model was 0.83, which is relatively high. This means that my K-means clustering model is preforming much better after reducing dimensionality from 4 dimensions (features) to two dimensions or 2 features which are Sepal length and Sepal width.
In conclusion, throughout this project, I am able to answer the two questions that I stated at the beginning. The answer for the question about the performance of the K-means clustering on this Iris dataset using all four features is that since the accuracy score of K-means algorithm using all four features was very low, only around 0.24, which definitely means k-means clustering model is not performing well since my K-means clustering algorithm with all 4 features only successfully and correctly clustered the Iris-virginica while our target in the original dataset has 3 spieces and the Iris-versicolor and Iris-setosa were not clustered correctly. The answer for the second question about if reducing dimensionality using PCA would improve the performance of my K-means model is definitely yes. After reducing dimensionality from four features to two features using PCA, I train my K-means model again with the new transformed features and the accuracy score now is 0.83, which is relatively high. This means that my K-means clustering model now performs much better after reducing dimensionality from 4 dimensions (features) to two dimensions or 2 features which are Sepal length and Sepal width.
References
What is Clustering and Different Types of Clustering Methods. https://www.upgrad.com/blog/clustering-and-types-of-clustering-methods/
Various Types of Clustering on Iris. https://www.kaggle.com/code/shinto/various-types-of-clustering-on-iris/notebook